|
The influence coefficients method calculates
the balancing solution based on the amplitude and phase measurements
resulted from the initial and two calibration start-ups. In parallel
with the balancing operation, the machine influence coefficients are
being determined and they may be further used for a balancing based on
the measurement of the initial imbalance only.
One of the main characteristics of the
analysis equipment is the sensitivity to the imbalance signal. This
depends on the dynamic range, sampling rate and processing and analysis
functions.
The most modern imbalance measuring
technique is the FFT.
To
increase the quality of the results, a range of additional functions are
being utilized.
FFT leakage
The FFT Leakage phenomenon may influence the
imbalance measurement through the energy exchange between the
fundamental component and the other spectral components.
The FFT analysis over an integer number of
cycles is not influenced by the FFT leakage.
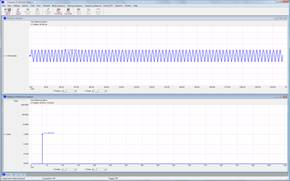
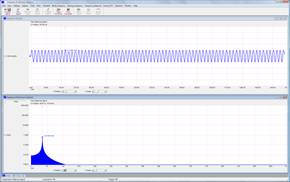
If
the waveform does not feature an integer number of cycles, the
fundamental component’s energy is being lost through the adjacent
frequency lines.
Solution:
Utilization of
synchronous FFT for the analysis over an integer number of
cycles
of the fundamental component.
The information alteration can also occur
through the energy exchange with the leakage-influenced harmonics.
Solution:
Time-domain filtering with band-pass FIR filters for the elimination of
the components outside the speed variation range.
 The
filtering operation must not alter the phase relationship between the
vibration and speed signals. The
filtering operation must not alter the phase relationship between the
vibration and speed signals.
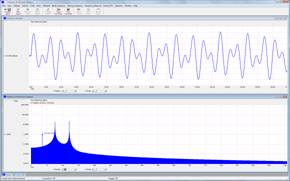
Speed variation
Most of the operational regimes feature
speed variations. In such conditions, the energy of the imbalance signal
spreads over multiple spectral lines and thus diminishes the measurement
accuracy.
Solution:
Harmonic order analysis with
run-up and run-down functions to turn the vibrations from
a time-domain unstationary signal into an angular-domain stationary
signal.
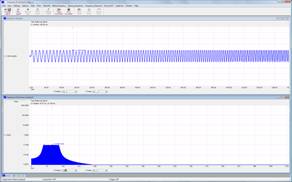
Background noise
The multitude of the vibration sources
received in the measuring points (imbalances, friction forces,
electromagnetic forces, shocks) generates a background noise within the
frequency spectrum. While it occurs in all of the frequency bands, it
may not be filtered out.
Solution:
Vector averaging to cancel out random spectral components.
Rotor balancing using the DSA 500 analyzer
DSA 500 is a 5 measurement channels, 24-bit
resolution, and 100kS/s/ch sampling rate handheld analyzer.
Balancing functionalities
-
Time-domain
continuous filtering and integration with keeping the phase between
the signals and spectral components
-
Order analysis: synchronous FFT, run-up/run-down
functions, vector averaging
-
Calculation based on the influence
coefficients method
-
Static, static-couple and dynamic
balancing
-
IS or British measuring units
-
Radius change and weight split options
-
Balancing tolerances for each plane
-
Limit exceeding warning
-
Excel format export
-
Balancing report
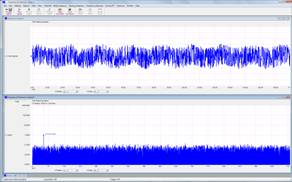
The accelerometers signal increase directly with the
vibration frequency. As a result, the acceleration signal displays
rather the high frequencies and not the lower ones corresponding to
speed and displacement.
The band-pass filtering provides for
the conditions of an optimal integration operation and reduces the FFT
leakage.
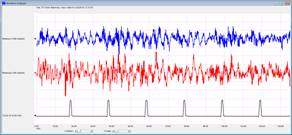
The velocity signals are being obtained upon
the band-pass filtering and continuous integration of the acceleration
signals.
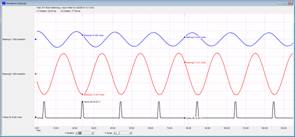
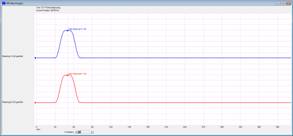
The order analysis processes the signal through run-up/run-down
functions, calculates the harmonics spectrum and performs a programmable
number of vector averages. The results are being used to calculate the
balancing solution.
 Download pdf
presentation
Download pdf
presentation |